Written with artificial intelligence by Tuko's editorial system, from the sources linked below. If you spot a mistake, write to joan@tukoteam.com.
ROAS vs customer acquisition cost: which one to check to know if your ads make money
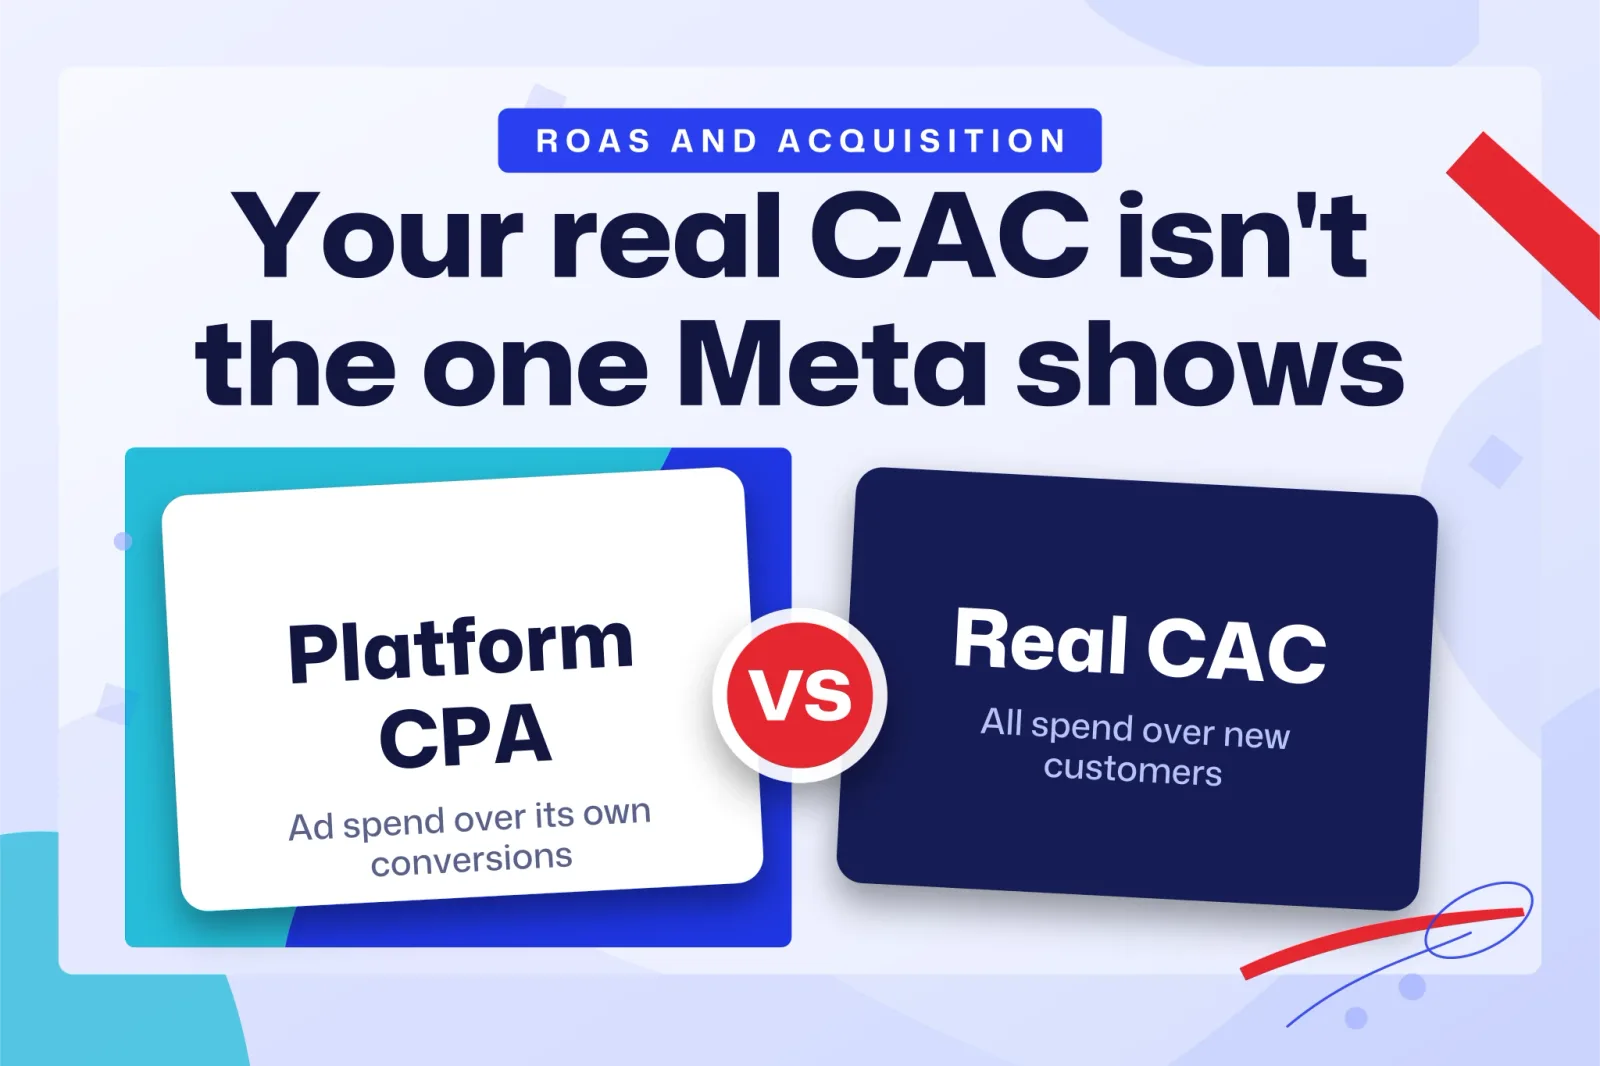
ROAS and customer acquisition cost answer different questions. ROAS (return on ad spend) is the revenue you get for every dollar spent on ads: attributed revenue divided by ad spend. Customer acquisition cost (CAC) is what it costs to win someone who had never bought from you: everything you spend on acquisition divided by the new customers you get. To know whether your advertising leaves money on the table you need both, and above all your margin per order.
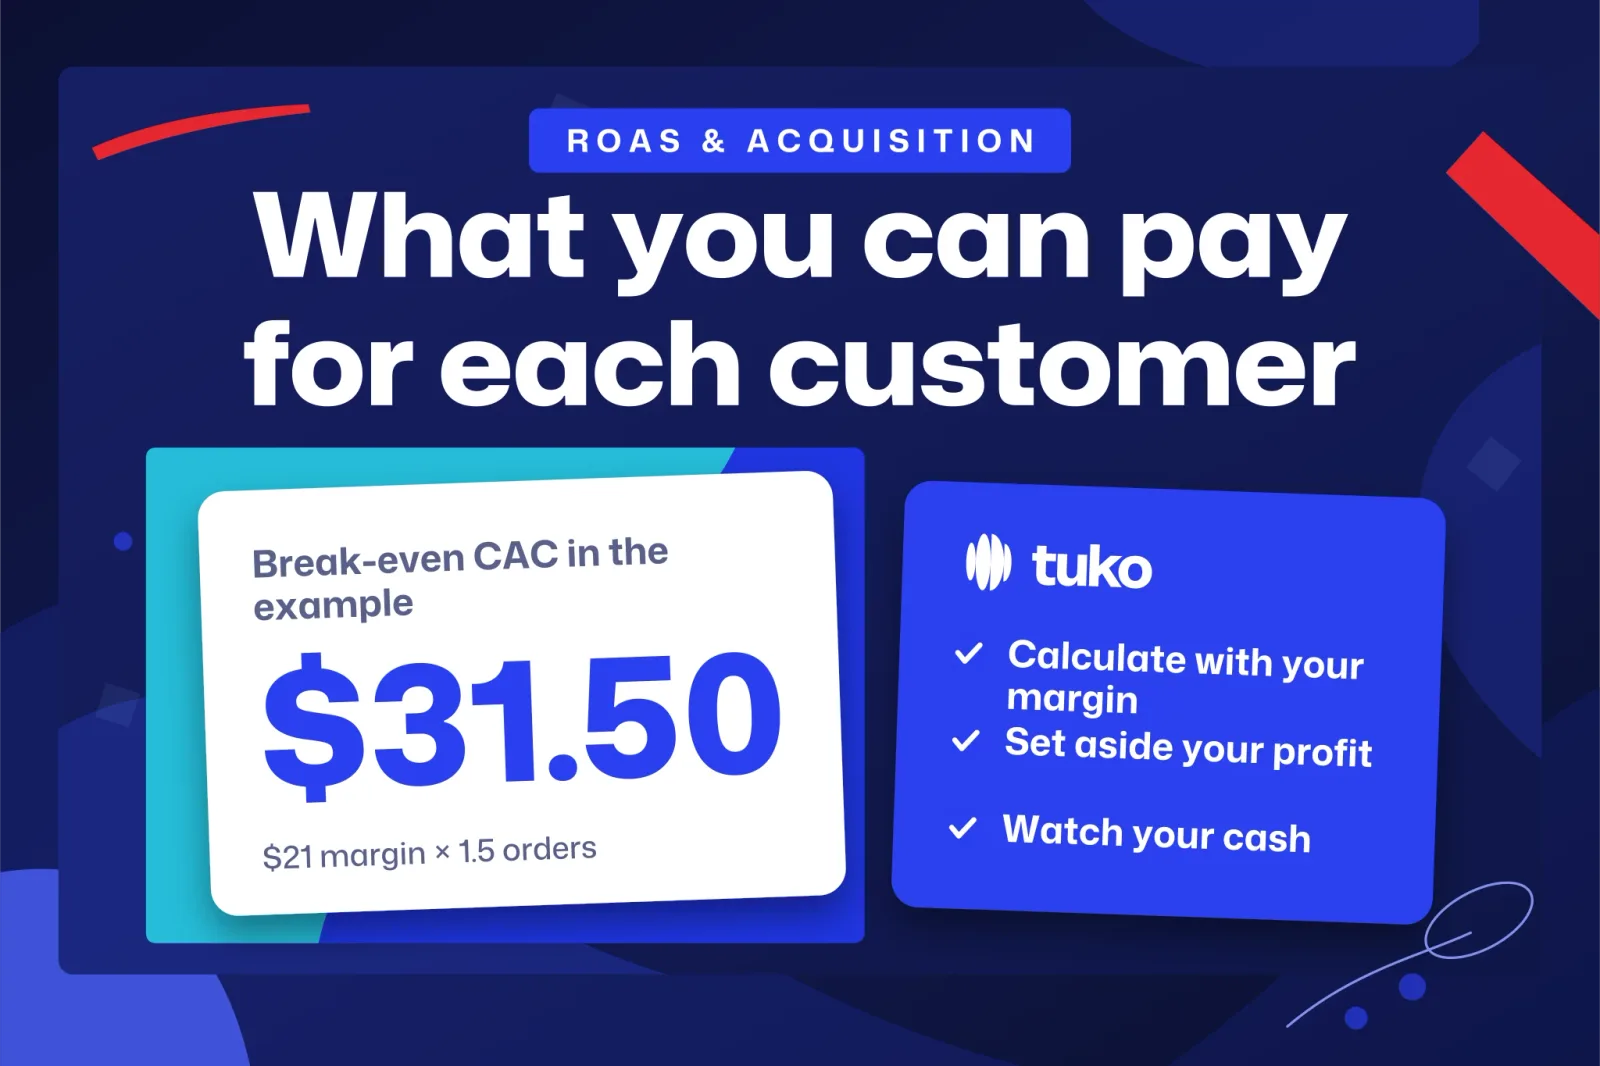
This guide goes from the basics to the decision. If you already know both metrics and only want your minimum, start with how to calculate break-even ROAS and how much each discount raises it. If your worry is how much to pay for each customer, the section on decisions points you to the full calculation.
What is the difference between ROAS and customer acquisition cost?
ROAS measures how much a campaign sells; CAC measures how much each new customer costs. The formulas are simple:
- ROAS = revenue attributed to ads ÷ ad spend.
- CAC = total acquisition spend ÷ number of new customers.
If you want a second reference for each metric, see Wikipedia's entry on customer acquisition cost and Shopify's guide to calculating ROAS (in Spanish).
The real difference sits in what each one counts and what it leaves out. ROAS counts every order the ad platform attributes to your ads, whether it comes from a new customer or from someone who already bought from you. CAC counts only new customers, so it tells you what you pay to grow your customer base.
| ROAS | CAC | |
|---|---|---|
| What it measures | Revenue per dollar of advertising | Cost of each new customer |
| Formula | Attributed revenue ÷ ad spend | Acquisition spend ÷ new customers |
| Which orders it counts | All attributed orders, new and returning | Only first orders from new customers |
| What it ignores | Margin, repeat purchases and whether the customer is new | Margin and repeat purchases, unless you cross them separately |
| What it is for | Comparing campaigns and ads against each other | Knowing what you pay to grow |
Neither includes your margin. That is why either one, looked at alone, can mislead you.
Why is a high ROAS not enough to know you are making money?
A high ROAS can coexist with losses because ROAS is about revenue and you live on margin. There are three reasons a campaign with a good ROAS can lose money:
- Margin. If you keep only a small share of each order after paying for the product, shipping and fees, you need to sell a lot per ad dollar just to cover the spend.
- Customers who were going to buy anyway. If many attributed orders come from regulars who would have come back without the ad, ROAS takes credit for sales the campaign did not create.
- Repeat purchases, in the other direction. ROAS only sees the first order. A campaign with a weak ROAS may bring customers who come back several times, and then it is better than it looks.
The first reason is solved with break-even ROAS: the minimum ROAS at which the campaign does not lose money. It is 1 ÷ contribution margin, where contribution margin is what is left of each order, as a percentage of the price before tax, after subtracting product cost, shipping you pay, payment fees and packaging, and before advertising. How to calculate break-even ROAS and how much each discount raises it has the step-by-step calculation and shows what happens to that minimum when you run sales.
All figures in this section are invented. They show how the minimum changes with margin:
| Contribution margin | Break-even ROAS (1 ÷ margin) |
|---|---|
| 20% | 5 |
| 25% | 4 |
| 30% | 3.33 |
| 40% | 2.5 |
| 50% | 2 |
One detail ruins many calculations. If the revenue behind your ROAS includes VAT or sales tax, strip it out before comparing it with your margin, or calculate the margin with tax too. Mixing the two gives a ROAS that looks better than it is.
Example: the same campaign seen through ROAS, CAC and margin
All figures in this section are invented. Take a hypothetical store that spends $2,000 in a month on a Meta campaign. Its starting data:
- Sales attributed to the campaign, before tax: $8,000.
- Average order value before tax: $50, so 160 orders.
- Product cost, shipping, fees and packaging per order: $35. That leaves $15 of contribution margin per order, 30%.
- Of the 160 orders, 100 come from new customers and 60 from customers who had bought before.
The calculation, step by step:
- ROAS: 8,000 ÷ 2,000 = 4.
- Break-even ROAS: 1 ÷ 0.30 = 3.33. The campaign is above it, so in the ad dashboard it looks profitable.
- Total margin against spend: 160 orders × $15 = $2,400. Minus the $2,000 of ads, $400 is left.
- CAC: $2,000 ÷ 100 new customers = $20. Each new customer costs $20 and their first order leaves $15, so you lose $5 per customer on the first purchase.
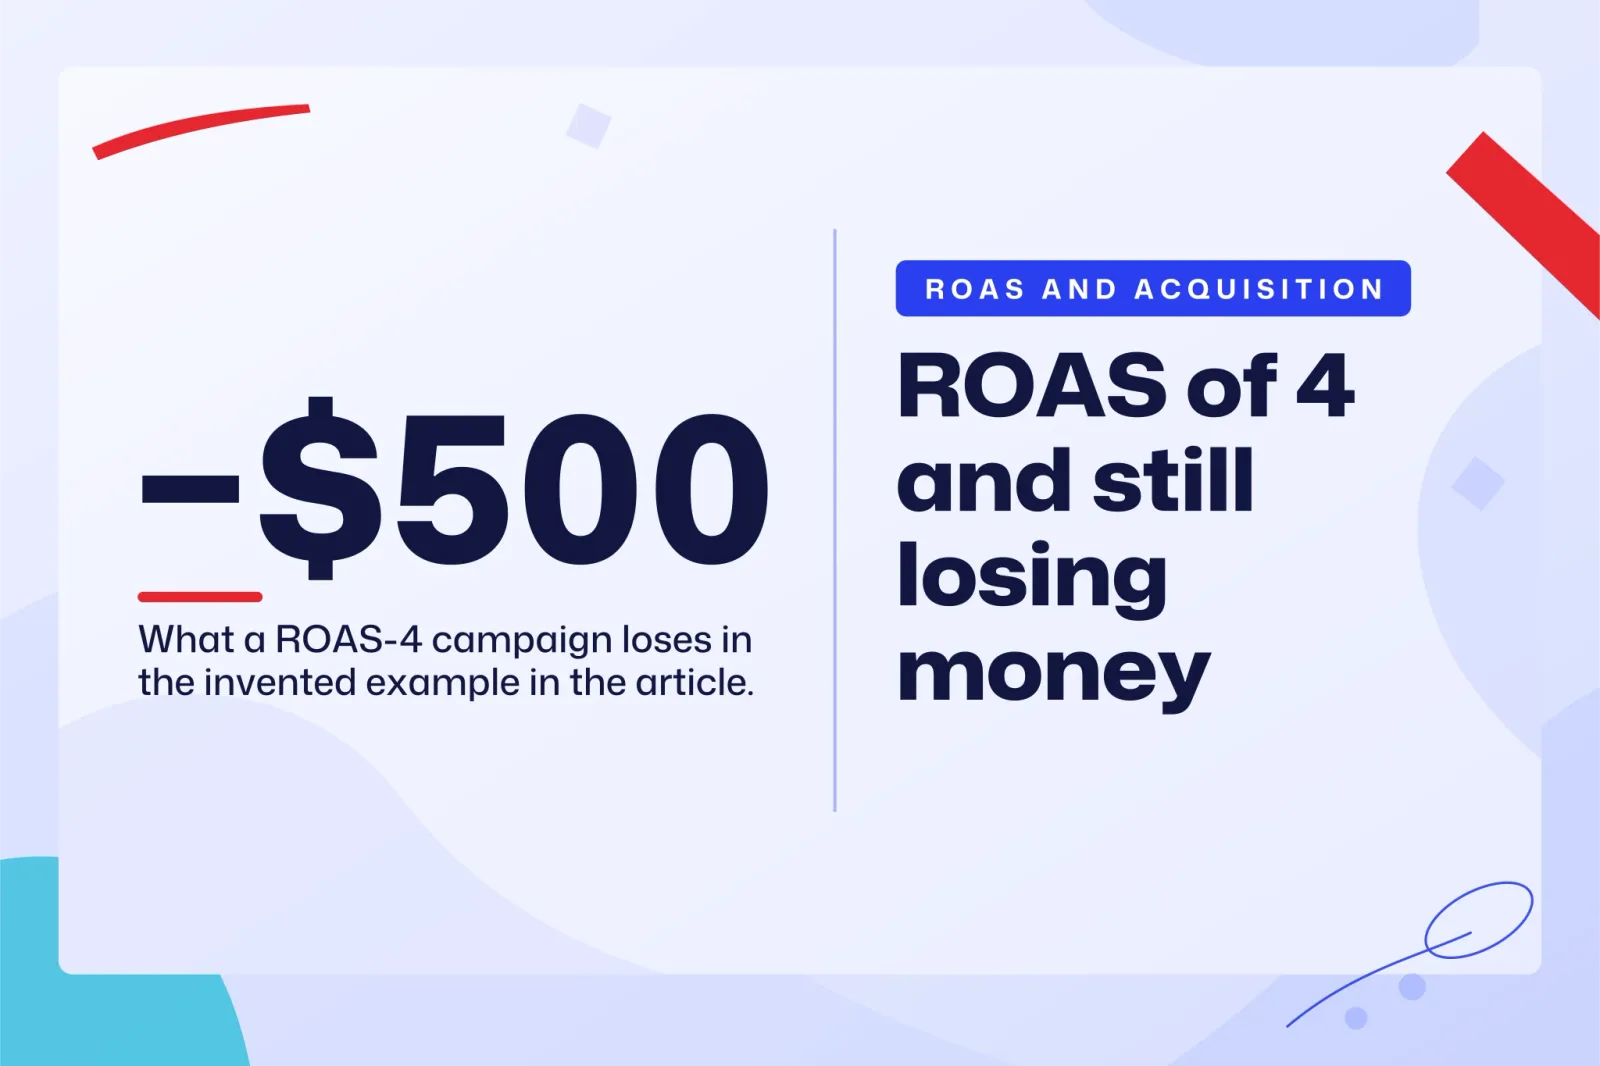
- If the 60 returning customers would have bought anyway: their margin is not generated by the campaign. The margin it does bring is 100 × $15 = $1,500, and 1,500 − 2,000 = −$500. With a ROAS of 4, the campaign loses $500.
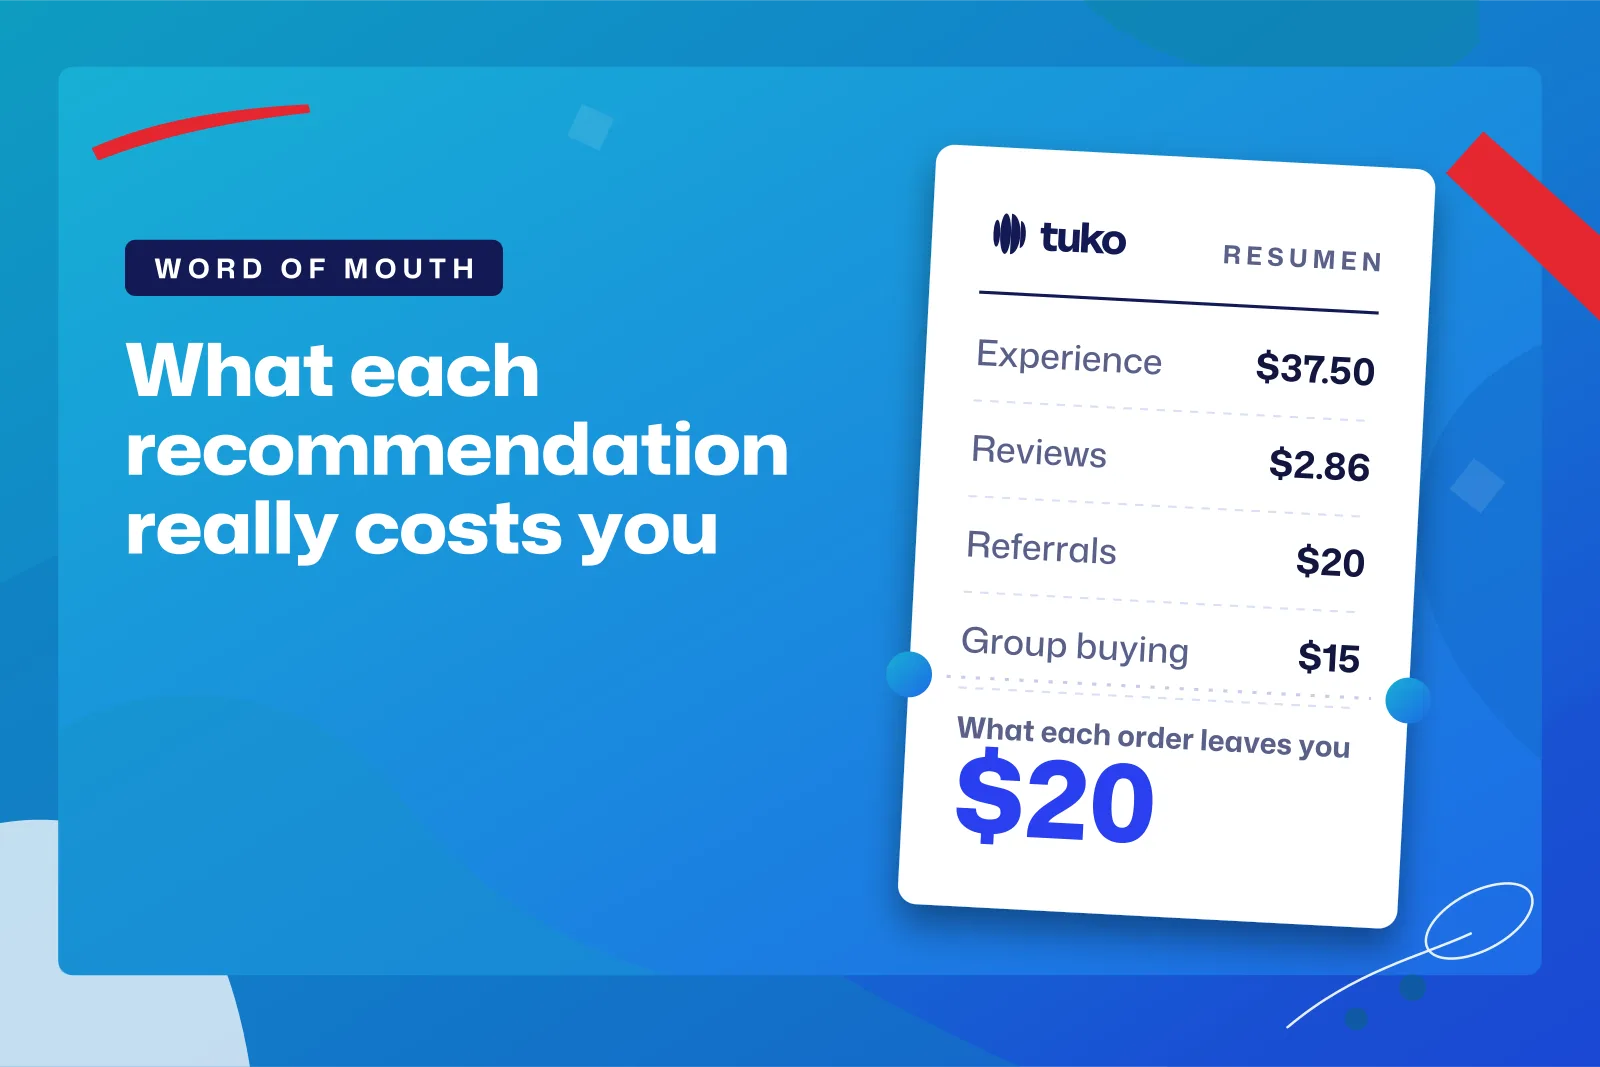
- If each new customer reorders 1.5 more times over the next 12 months: the accumulated margin per customer is $15 × 2.5 orders = $37.50. With a CAC of $20, each customer leaves $17.50 net over the year, and the 100 together make 3,750 − 2,000 = $1,750.
| Input or result | Value |
|---|---|
| Ad spend | $2,000 |
| Attributed sales before tax | $8,000 |
| Orders (new / returning) | 160 (100 / 60) |
| Contribution margin per order | $15 (30%) |
| ROAS | 4 |
| Break-even ROAS | 3.33 |
| CAC | $20 |
| Result counting all orders | +$400 |
| Result if returning customers would have bought anyway | −$500 |
| Result at 12 months with 1.5 repeat orders per new customer | +$1,750 |
The same campaign makes $400, loses $500 or makes $1,750 depending on what you ask. The ROAS of 4 does not change in any of the three cases. What changes is how many orders are truly new and how much each customer buys again.
Two practical readings follow. A CAC above the margin of the first order can still pay off if repeat purchases really exist and you can measure them in your own orders, not if you assume them. And a high ROAS propped up by customers who already knew you is the most comfortable way to lose money without noticing. To see how much that weighs in your store, the logical step is to split people who have already bought into a separate campaign and watch how their orders change when you stop showing them ads for a few weeks.
How do you calculate real CAC if you discount the first purchase?
A welcome discount is part of the cost of winning the customer, so it goes in the numerator: real CAC = (ad spend + first-purchase discounts + other acquisition costs) ÷ new customers. If you leave it out, your CAC looks lower than what you pay.
All figures in this section are invented. If the store from the example above gives each new customer 10% off a $50 first order, it gives away $5 per customer. With 100 new customers that is $500. Real CAC becomes (2,000 + 500) ÷ 100 = $25. The first order, calculated at full price, leaves $15, so the loss on the first purchase rises from $5 to $10 per customer. With the same repeat orders, the accumulated margin of $37.50 still covers the $25, but the result for the year drops to 3,750 − 2,500 = $1,250.
Count the discount once. If you add it to CAC, calculate the first-order margin at full price. If you prefer to subtract it from the first-order margin, do not add it to CAC. Both ways reach the same result; doing both at once counts it twice.
The numerator should also include the fee of the agency or freelancer running the ads and the cost of creatives, if they only exist to acquire customers. Leaving them out is the usual way a CAC comes out looking pretty.
Which number should you look at for each decision?
Look at ROAS to choose between campaigns, break-even ROAS to know your minimum, CAC to know what you pay to grow, and CAC against accumulated margin to decide how much to spend. Each metric answers a different question:
| Your question | What to look at | How it is calculated |
|---|---|---|
| Which campaign or ad works best? | ROAS | Attributed revenue ÷ spend |
| Does this campaign at least cover its cost? | ROAS against break-even ROAS | 1 ÷ contribution margin |
| What does each new customer cost me? | Real CAC | (Spend + acquisition discounts + other costs) ÷ new customers |
| How much can I pay for a customer? | CAC against accumulated margin | Maximum CAC ≤ margin one customer leaves within the time you can wait to recover it |
| Is my advertising growing the store? | Number of new customers and their CAC | New customers this month and what they cost |
The last row is the one people forget most. An ad account can hold a steady ROAS for months while selling almost always to the same customers, and the customer base does not grow.
Maximum CAC depends on how long you can wait to recover what you pay. A store with tight cash should require that the customer pays back on the first order or within a few months; one with comfortable cash can look at a year. How much you can spend to acquire a customer without losing money works out that ceiling from your margin and your repeat rate.
How can you lower CAC without spending more on ads?
CAC drops when part of your new customers arrive without you paying for an ad for them. The calculation that matters here is blended CAC: everything you spend on acquisition, from any channel, divided by all new customers. For example, if $2,000 of ads brings in 100 customers and another 25 arrive through recommendation at no cost, blended CAC falls from $20 to $16. If the recommendation carries a reward, add it to the numerator.
Referrals are the most direct route: one customer brings another in exchange for something. The reward is an acquisition cost and has a ceiling, the same maximum CAC as above. How referral marketing works in ecommerce covers how much you can pay per referred customer without losing margin and which kind of reward suits which store.
Word of mouth without a reward is cheaper, but harder to trigger and to measure. The word of mouth marketing strategy for ecommerce shows what you can do to make it happen and how to work out what each customer who arrives that way costs you.
Group buying is another way for one customer to bring another, and it is what Tuko does. The app adds a group-buy button to the product page: the customer pays with the discount already applied, shares their link, for example on WhatsApp, and the group completes when one more person joins. The lower price applies only if someone else joins, so nobody gets the discount without bringing another customer, which is exactly the problem with a store-wide discount. It has a cost worth counting: both buyers get the discount, including the first one, who might have bought anyway. That double discount goes in the CAC numerator, just like a referral reward. And if the group does not complete, the first customer chooses between keeping the missing units at the group price, moving to another open group or getting their money back.
Frequently asked questions
What ROAS is good for a Shopify store?
There is no universal good ROAS: it depends on your margin. A ROAS is enough when it clears your break-even ROAS (1 ÷ contribution margin) with room to spare for orders from customers who would have bought anyway. With a thin margin you need a much higher ROAS than with a fat one.
Do the ad dashboard and your store report the same ROAS?
Do not assume they match. Ad platforms report the sales they attribute to their own ads, which is probably why the same sale can appear in more than one dashboard. Our recommendation is to use the dashboard ROAS to compare campaigns against each other, and to do the margin and CAC math with the orders and new customers your store records.
Why is my ROAS high and I still do not make money?
The usual causes are a low contribution margin, which puts your break-even ROAS above the one you see, or a campaign that mostly sells to customers who already bought from you. It can also happen that you calculate ROAS with tax included and margin without it. Repeat the calculation from the example with your own data and you will see which of the three it is.
What to do now with your numbers
Pull last month's orders from Shopify, separate new customers from returning ones and calculate your contribution margin per order. With that you have your break-even ROAS, your real CAC and the answer to whether your ads grow the store. If the margin per order falls short, work on the order first: how to increase average order value with bundles, free shipping and cross-sell and how to optimize your store's conversion rate and margin give you the levers. And if you want part of your new customers to arrive through the ones you already have, you can install Tuko from the Shopify App Store in about two minutes, without touching your theme.